A while ago I wrote a post suggesting that Ukraine’s propensity for revolution might have something to do with its high level of government corruption in combination with its relatively well-developed civil society. As evidence for this, I showed that Ukraine (together with Kyrgyzstan and Moldova, two countries that have also recently experienced political unrest) was an outlier among post-Soviet states with respect to the relationship between corruption perceptions and authoritarianism. This finding was interesting, but by no means robust enough to warrant broad generalizations about corruption and democracy and revolution.
Since then, a few others chimed in with some ideas. Ben Jones suggested looking at corruption and authoritarianism in countries that experienced revolutions over time. Cavendish McCay looked at corruption and authoritarianism data from the same sources but over the entire globe, and produced a very cool visualization. He also pointed me to the World Bank’s Worldwide Governance Indicators, which contains measures of democracy, corruption, and political stability. Perhaps it would be possible to test my hypothesis empirically using these data. This could be done for individual regions or for the whole world, and could also have a temporal component (the indicators have been published since 1996).
In order to determine if such an analysis is feasible, I decided to take a closer look at the dataset (which is free and downloadable from the website). The Worldwide Governance Indicators (WGI) project is an ambitious one. The authors compile data from 31 different sources (such as think tanks, NGOs, private firms) and produce annual scores for every country for six indicators of the quality of governance. The indicators are:
- Voice and Accountability
- Political Stability and Absence of Violence
- Government Effectiveness
- Regulatory Quality
- Rule of Law
- Control of Corruption
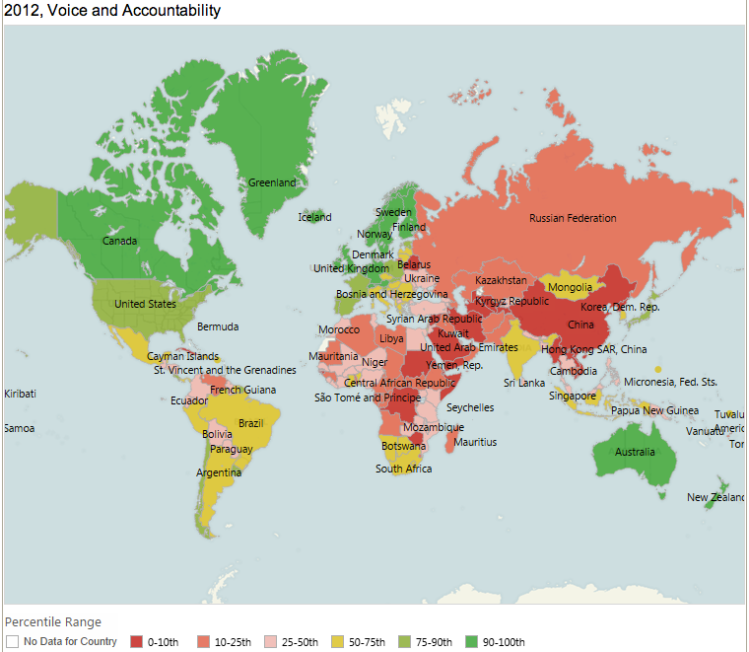
First off, we can look at the data on a map. Fortunately the WGI website has a series of nice Tableau interactive graphics, including maps:
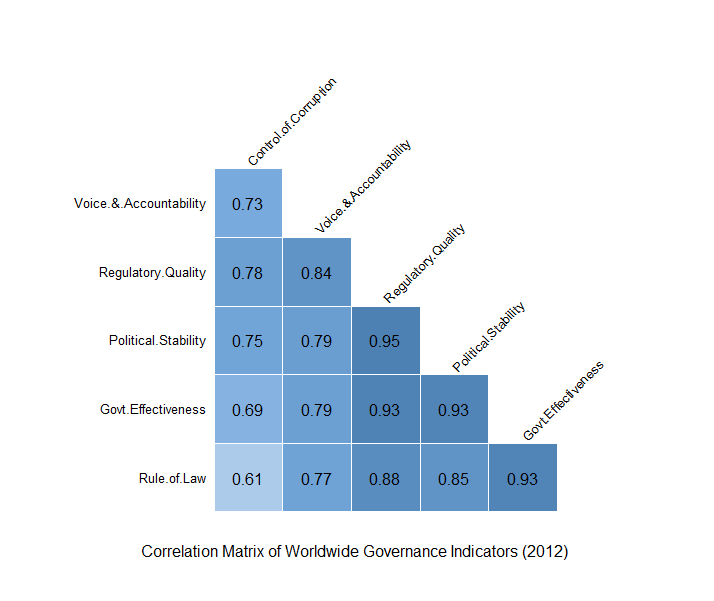
Looking at the indicators geographically is helpful. But to evaluate whether they can be used to test the hypothesis, I want to see how each indicator is correlated with all the others. For this, we’ll turn to R. Here is a correlation matrix of the six indicators as calculated for 2012. Positive correlations are reflected as positive values. The closer the the number to one, the stronger the correlation.  As you can see, all the indicators are positively correlated to each other, some very strongly. This is not surprising. We would expect well-governed countries to get high marks for rule of law, regulatory quality, control of corruption, etc. One interesting observation here is that Control of Corruption actually has the lowest correlations of all the indicators. A scatter plot matrix is a good way to look at the data in more detail:

The idea for this variation on the scatter plot matrix comes from Winston Chang’s R Graphics Cookbook. Its structure is similar to the correlation matrix in that all of the indicators are plotted against each other. The lower panels show scatter plots with LOESS regression lines for each indicator pair. This plot has some extra bells and whistles thrown in – histograms of the distribution of each in indicator in the diagonal panels and correlation coefficients (just like the correlation matrix) in the upper panels. The scatter plots show the strong to moderate correlations that we already saw in the correlation matrix, but allow us to make out some curious features of the data, like the non-linear relationship between Voice and Accountability and many of the other indicators.
The indicator values are in units of a standard normal distribution. A value of zero is the mean, while a value of one is one standard deviation higher than the mean. Given the distributions, the indicator values range from about -2.5 to 2.5. Positive values represent better governance, negative represent worse. Because each indicator is measured on the same scale, we can simply sum all six to determine the overall “best governed” country. The top six are:
Country     sum

FINLAND     11.19

SWEDEN      10.94

NEW ZEALAND 10.83

NORWAY      10.67

DENMARK     10.59

SWITZERLAND 10.57
And the bottom six:
 SOMALIA              -13.65

CONGO, DEM. REP.     -9.76

SUDAN                -9.74

SYRIAN ARAB REPUBLIC -9.53

AFGHANISTAN          -9.48

KOREA, DEM. REP.     -9.35
I got a bit carried away examining the correlations between the governance indicators, but in a subsequent post I hope to look closer at the democracy – corruption – stability hypothesis. I’m still not quite sure what statistical tests to use and how to apply them, and I’d welcome any ideas. Data and code are posted on Github (github.com/caluchko/wgi)


