This is the second in a multiple part series on mercury. In the last post, we explored global mercury prices and production over the last century. In this post, my aim is to answer the following questions: Is is possible to resolve a signal in the price of mercury that is attributable to its use in gold mining? Could the price of mercury be used as a predictor of the amount of gold produced using mercury?
First, some background. Mercury has a very interesting property in that it forms amalgams with other metals. A silver dental filling is an amalgam of mercury and silver. If you add mercury to ore or sediment containing gold, the mercury will suck up some of the gold into an amalgam. Then you can heat the amalgam to evaporate the mercury, leaving you with just gold.
This method was used for centuries to recover gold and silver. Today, large-scale industrial mines use other methods that are more efficient and do not release persistent, toxic, and bio-accumulative mercury into the environment. However, mercury is still widely used in artisanal and small-scale gold mining (ASGM). In fact, mercury use in this sector is probably increasing, and is now believed to be the largest source of mercury pollution in the world. The recent spike in gold prices is often cited as a cause of increased ASGM and associated mercury use.
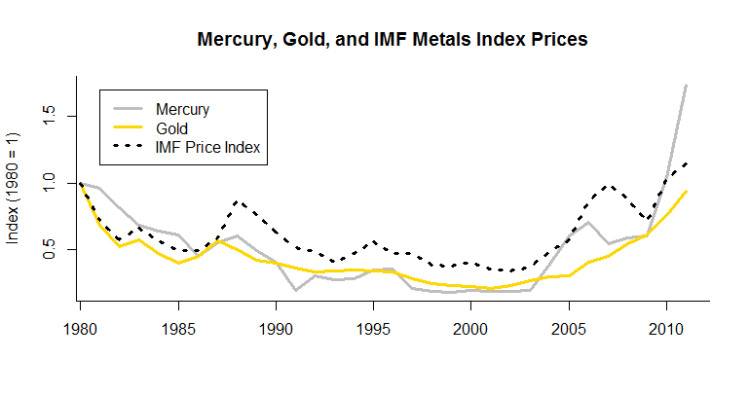
Because ASGM activity is decentralized, often illegal, and commonly occurs in hard to reach parts of developing countries, it is very difficult to estimate the magnitude and trends of mercury use. But we do have data from the USGS on the prices of gold and mercury. In the last post we looked at the time series for mercury prices since 1900. Here, we are only going to look at the period from 1980-2011. (The modern ASGM period really started around 1980.) The chart below shows the inflation-indexed prices of mercury and gold. I’ve normalized them to an index where the 1980 price equals one so that I can show both series on one plot. Mercury and gold prices appear to be closely correlated. The high correlation coefficient (0.89) confirms what we see in the plot. The series only diverge significantly after 2009, and we’ll look at that period more closely at the end of the post.
But the close correlation of mercury and gold prices is not enough to conclude there is a causal relationship. Perhaps there is a lurking variable that is correlated with the prices of both metals. Mercury and gold are certainly not substitutes for each other. No one buys mercury when they are worried about inflation, for example. But maybe mercury and gold prices are both are correlated to overall commodity prices. To find out I plotted an index of metals prices from the IMF (also normalized to one and corrected for inflation) together with the metals prices: The correlation looks close, and indeed the the correlation coefficients of the metals price index with the prices of gold and mercury are both about 0.8. This is not quite as close as the correlation of gold and mercury prices to each other, but it’s too close to conclude that either time series is all that different from the overall trend in commodity metal prices.
Now is a good time to point out that mercury has other uses besides to gold mining, such as in certain products (like thermometers) and industrial processes (like making chlorine). Demand from these other uses is going to affect the price. Of course, the supply of mercury will also have an affect on price. In attempting to see a signal in the price of mercury caused by gold mining, the implicit assumption is that other factors affecting the price of mercury (the supply and demand) remain relatively constant with respect to each other over the time period. This is not a terrible assumption. In general both non-ASGM demand for mercury and mercury supply have been decreasing over the last 30 years. But the assumption does introduce some real uncertainly into the analysis. It is difficult to correct for because we don’t have good data on mercury use by sector over the time period.
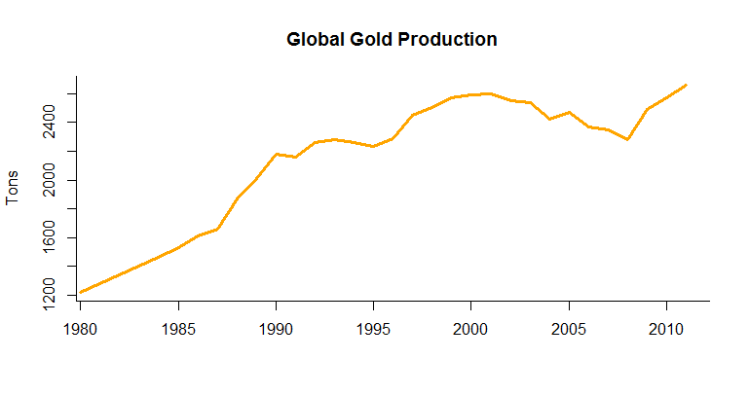
There’s one more problem. Recall that the hypothesis is that mercury use in ASGM affects the price of mercury. We were using the price of gold as a proxy for mercury use in ASGM. That sounds like a reasonable assumption. High gold prices should mean more gold being extracted, and greater demand for mercury to extract the gold. But what really determines mercury use is the amount of gold produced, not the price. And we actually have data on global gold production. It tells a different story: If anything, global gold production is negatively correlated with gold price over the last ~30 years! I don’t know why this is. One possible explanation has to do with the lag time of starting a mining operation. Perhaps the record high gold prices of the late 1970s and early 1980s caused a wave of exploration and new mines. Once those mines were developed, they could produce gold economically even at low prices. Perhaps technology improved so that it was cheaper to find and develop gold deposits.
This leads to one more complicating factor. Most gold is produced by large scale mines (which do not use mercury). Common estimates suggest that only about 12-20% of gold is produced by rough artisanal miners. Another implicit assumption in this analysis has been that the fraction of gold produced by ASGM has remained constant over time. But this may not be the case. Small-scale miners are likely to be able to take advantage of high gold prices more quickly than the majors, where exploration, permitting, and construction can mean many years before a mine becomes operational. Small-scale miners can often start mining almost immediately. This would mean than gold and mercury prices would be more closely correlated than one would expect when looking at global gold production. On the other hand, work by the Artisanal Gold Council has shown ASGM prevalence is “sticky” with respect to gold prices. That is, once they start mining, artisanal miners are likely to continue their operation even after the price of gold drops.
Finally, let’s reexamine the period from 2009-2011, when the price of mercury rises much more rapidly that the price of gold. I don’t think there’s an obvious explanation for this. Perhaps mercury use in ASGM really takes off in this period. Another wrinkle is the establishment of bans on mercury export in the EU (took effect in 2011) and the U.S. (took effect in 2013). Maybe buyers were trying to purchase European and U.S. mercury ahead of the ban, driving up the price. We could look at export data to find out.
As you can see, this is an extremely complicated issue. Without better data, it is not possible to resolve a signal in mercury prices that can be attributed to gold prices or gold production. Even though this exercise did not yield a clear result, I think it is important to document the effort. In data analysis (and science in general), the lack of a clear conclusion is in itself an important piece of information.
In the next mercury installment we’ll travel to Ukraine and Kyrgyzstan to learn how the elusive metal is wrested from the earth and what sorts of environmental, economic, and social impacts this mining brings.


