10 Maps that Explain Switzerland

Ah, Switzerland. Land of fondue, chocolate, and neutrality. If you want to learn more about this unique little country, maps are a great way to start. Not only does Switzerland have fascinating geography, but it also has a long and storied tradition of cartography and design.

1. Where in the world?

But you already knew that, right? And you also knew that the capital is Bern, not Zurich or Geneva. Switzerland is not very big. It’s the world’s 135th largest country. Four U.S. counties are larger. But what it lacks in size it makes up in other ways. For example, The Economist ranked it the best country in the world to be born in.

2. Confoederatio Helvetica

cantons-page-001
Switzerland is made up of 26 cantons, many of which were established as sovereign states hundreds of years ago. Then, in 1848, with the establishment of the Swiss Constitution, the cantons joined together to form the Swiss Confederation, or in Latin,  Confoederatio Helvetica. That’s where the abbreviation “CH” comes from.

Switzerland is a federal states and the cantons still retain strong identities and policy autonomy, in a way that’s analogous to the states in the U.S.

3. A multilingual nation

Switzerland has four official languages: German (the most prevalent), French, Italian, and Romansh. Romansh is spoken by less than 1% of the population, and only in a few places in Eastern Switzerland. I personally have never heard an utterance of Romansh. But it’s the only language unique to Switzerland, so I suppose it has a special place in the Swiss national identity.

The Swiss have a well-deserved reputation as polyglots. Almost all Swiss people I know speak at least two Swiss languages plus English, and some many more.

4. Let’s get physical

land use-page-001

This map shows the terrain of Switzerland together with land use. You can immediately see that Switzerland is a mountainous country, with the Alps  dominating the southern 2/3 and the smaller Jura Mountains along the northwest border. The bit in the middle, which is also where most of the people live, and most of the agricultural land and industrial production are located, is called the Swiss Plateau.

You’ll also notice the lakes. Switzerland has a lot of them, including some of the biggest lakes in Europe. Most Swiss lakes, including Geneva, were formed when the ice sheets of the last glacial period retreated, leaving deep basins carved by ice, and filling with water from the melting glaciers. More on the ice age below.

5. A geologist’s paradise

Ok, this one’s not a map. It’s a geologic cross section (source) showing a very simplified version of what the earth might look like if you cut out a slice 50 km deep and several hundred km long from Italy in the south, through the heart of the Swiss Alps, and north into France. The diagram gives an idea of the folding and faulting wrought by the massive tectonic collision that created the Alps.

In simplest terms, the Alps formed when two tectonic plates, the African and Eurasian plates, collided over millions of years. It all started in the Late Cretaceous, around 100 million years ago, when the ocean that separated what are now Eurasia and Africa began to close. Eventually the two continental masses themselves collided, with rocks on African side thrust up and over the Eurasian plate. The suture where the two plates became fused is called the Insubric Line.

The Alps are tectonically active to this day, raising up on the order of 1 mm per year. To geologists, the Alps are special because they were the first collisional mountain range to be studied extensively and much of the early understanding of structural geology comes from those pioneering Alpine studies.

6. The ice age

LGM

Made with the Swiss Federal Geoportal mapping tool

If the great tectonic collision provided the medium of folded, faulted and uplifting rock, the ice ages were the sculptor who fashioned the Swiss Alpine landscape into the wonder that we recognize today. The map above shows the extent of the ice cap that covered much of present-day Switzerland during the last glacial maximum, about 20,000 years ago.

The glaciers carved the spectacular U-shaped valleys and jagged peaks of the Alps. They also created the basins that would eventually be filled with water and form the Swiss lakes. Other evidence of the the glaciers is often visible in Switzerland, such as great boulders carried by the ice and stranded, and gentle hilly moraines that dot the Swiss Plateau.

7. The trains run on time

Back to the present day. One of the best things about Switzerland is the passenger train network, depicted on the map above, which you’ll find in every train car and station in the country. It’s the densest passenger network in Europe. You really can get just about anywhere on the train, even high into mountain villages on the many cog wheel and narrow gauge lines. And the trains are on time. Well, 95% of them, according to the Swiss national railway company. To really appreciate the attention to detail that the Swiss give to rail travel, check out this incredible diagram.

8. Let’s hit the slopes

When you think of Switzerland, you think of skiing, and the Swiss Alps have some of the top ski resorts in the world. One thing I love about the alpine ski resorts, aside from the great slopes, are the beautiful hand drawn piste maps. Here’s one of the Grindlewald/Wengen area in the Bernese Oberland. Just looking at it makes me want to start planning next year’s ski trip.

9. Direct democracy

Anti-Einwanderungsinitiative 2014.svg

“Anti-Einwanderungsinitiative 2014” by Furfur, based on the file Kantone der Schweiz.svg, made by KarzA. – Own work, data source: Neue Zürcher Zeitung: SVP-Abstimmungskrimi vorbei: Die Überraschung ist perfekt. Licensed under CC BY-SA 3.0 via Wikimedia Commons.

Switzerland is famous for its direct democracy, the process whereby voters frequently weigh in on referendums, popular initiatives, and even have veto power over laws.  The Swiss vote a lot. Elections happen about four times a year and often contain several referendums at the national, cantonal, and local level, as well as ballots for elected representatives.

The map above shows the results of a popular initiative in 2014 that sought to restrict immigration by EU nationals into Switzerland. It passed narrowly, with strong support from the Italian- and German-speaking regions and despite opposition in the French-speaking regions.

Immigration is a contentious issue in Switzerland (as in many other parts of the world). Relative to its population, immigration levels are quite high, compared to say, Germany or even the U.S. In some cases, xenophobia wins out in popular initiatives, such as when the Swiss voted in 2009 to prohibit the construction of minarets.

10. A rich cartographic history
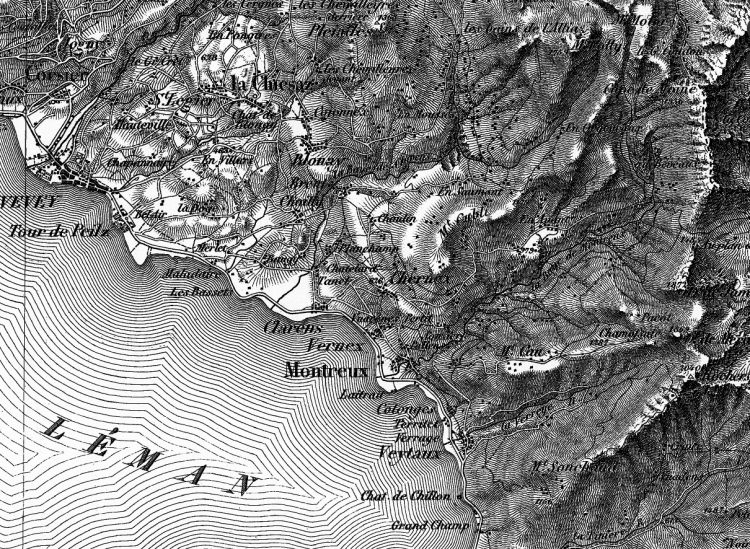
Dufour
With its varied geography and strong scientific and educational traditions, it’s no surprise that Switzerland has produced some stunning cartography. The first official map series to encompass all of Switzerland was produced by Guillaume-Henri Dufour and published from 1845-1865. The result of decades of surveying, drawing, copperplate engraving, and printing, the map achieved a high level of accuracy and detail for its time, and is also distinguished by the attractive use shading to show topography. More information on the Dufour map, as well as the equally impressive Siegfried map is available here.

Swiss excellence in mapping continues to this day. For example, the Federal Geoportal has a great mapping tool that allows you to access and display hundreds of data layers, from road networks to wetlands.

Getting to Know the Worldwide Governance Indicators

A while ago I wrote a post suggesting that Ukraine’s propensity for revolution might have something to do with its high level of government corruption in combination with its relatively well-developed civil society. As evidence for this, I showed that Ukraine (together with Kyrgyzstan and Moldova, two countries that have also recently experienced political unrest) was an outlier among post-Soviet states with respect to the relationship between corruption perceptions and authoritarianism. This finding was interesting, but by no means robust enough to warrant broad generalizations about corruption and democracy and revolution.

Since then, a few others chimed in with some ideas. Ben Jones suggested looking at corruption and authoritarianism in countries that experienced revolutions over time. Cavendish McCay looked at corruption and authoritarianism data from the same sources but over the entire globe, and produced a very cool visualization. He also pointed me to the World Bank’s Worldwide Governance Indicators, which contains measures of democracy, corruption, and political stability. Perhaps it would be possible to test my hypothesis empirically using these data. This could be done for individual regions or for the whole world, and could also have a temporal component (the indicators have been published since 1996).

In order to determine if such an analysis is feasible, I decided to take a closer look at the dataset (which is free and downloadable from the website). The Worldwide Governance Indicators (WGI) project is an ambitious one. The authors compile data from 31 different sources (such as think tanks, NGOs, private firms) and produce annual scores for every country for six indicators of the quality of governance. The indicators are:

  • Voice and Accountability
  • Political Stability and Absence of Violence
  • Government Effectiveness
  • Regulatory Quality
  • Rule of Law
  • Control of Corruption

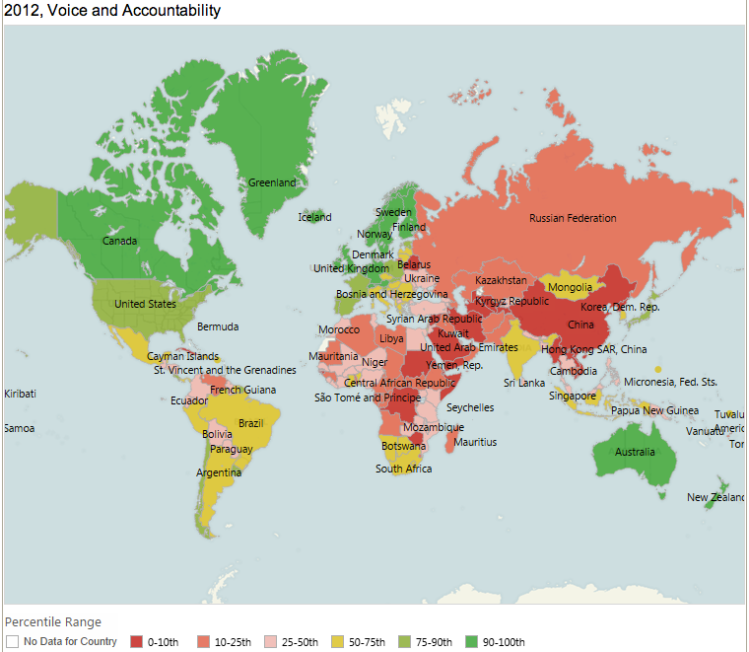
First off, we can look at the data on a map. Fortunately the WGI website has a series of nice Tableau interactive graphics, including maps:

Screen Shot 2014-04-27 at 2.17.49 PM

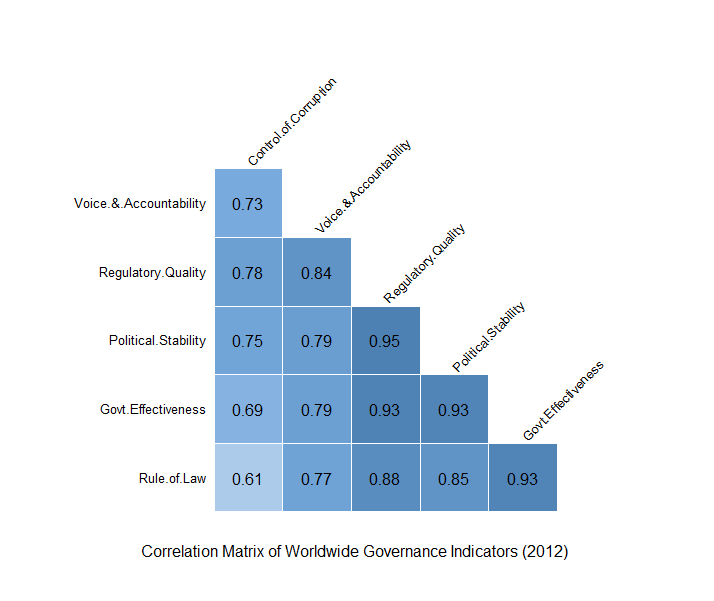
Looking at the indicators geographically is helpful. But to evaluate whether they can be used to test the hypothesis, I want to see how each indicator is correlated with all the others. For this, we’ll turn to R. Here is a correlation matrix of the six indicators as calculated for 2012. Positive correlations are reflected as positive values. The closer the the number to one, the stronger the correlation. wgi.corrplot As you can see, all the indicators are positively correlated to each other, some very strongly. This is not surprising. We would expect well-governed countries to get high marks for rule of law, regulatory quality, control of corruption, etc. One interesting observation here is that Control of Corruption actually has the lowest correlations of all the indicators. A scatter plot matrix is a good way to look at the data in more detail:
wbi.splom.plot

The idea for this variation on the scatter plot matrix comes from Winston Chang’s R Graphics Cookbook. Its structure is similar to the correlation matrix in that all of the indicators are plotted against each other. The lower panels show scatter plots with LOESS regression lines for each indicator pair. This plot has some extra bells and whistles thrown in – histograms of the distribution of each in indicator in the diagonal panels and correlation coefficients (just like the correlation matrix) in the upper panels. The scatter plots show the strong to moderate correlations that we already saw in the correlation matrix, but allow us to make out some curious features of the data, like the non-linear relationship between Voice and Accountability and many of the other indicators.

The indicator values are in units of a standard normal distribution. A value of zero is the mean, while a value of one is one standard deviation higher than the mean. Given the distributions,  the indicator values range from about -2.5 to 2.5.  Positive values represent better governance, negative represent worse. Because each indicator is measured on the same scale, we can simply sum all six to determine the overall “best governed” country. The top six are:

Country     sum
FINLAND     11.19
SWEDEN      10.94
NEW ZEALAND 10.83
NORWAY      10.67
DENMARK     10.59
SWITZERLAND 10.57

And the bottom six:

SOMALIA              -13.65
CONGO, DEM. REP.     -9.76
SUDAN                -9.74
SYRIAN ARAB REPUBLIC -9.53
AFGHANISTAN          -9.48
KOREA, DEM. REP.     -9.35

I got a bit carried away examining the correlations between the governance indicators, but in a subsequent post I hope to look closer at the democracy – corruption – stability hypothesis. I’m still not quite sure what statistical tests to use and how to apply them, and I’d welcome any ideas. Data and code are posted on Github (github.com/caluchko/wgi)


One Chart that Explains Why Ukraine was Vulnerable to Revolution

After months of protests, Ukraine slipped into violence last week as government forces attacked protesters in Kyiv. Then, in a frantic 48 hours, President Viktor Yanukovych’s government collapsed, rival politician Yulia Timoshenko was released from prison, and Yakukovych fled into hiding.  It was a stunning victory for the “maidanovtsi”, those protesting on Kyiv’s Maidan and those supporting the protesters around the county and the world.

I’m reading Bruce Bueno de Mesquita’s The Predictioneer’s Game, which is about analyzing incentives to make political forecasts. This book got me thinking about Ukraine. Why did Yanukovych fall? Sure, he was corrupt, but so are many leaders in the region.

What happened in Ukraine was very complex. But it seems to me that at a basic level, the obvious corruption of the Yakukovych government,  combined with Ukraine’s relatively open and democratic society, led to an unstable situation.

To test this intuition, I looked at data from The Economist’s Democracy Index and Transparency International’s Corruption Perception Index. This plot shows where the former Soviet republics fit on the corruption – authoritarianism plane (click on the image for interactive version):

demo cor2

It is instructive to divide this plot into quadrants. The lower left quadrant shows those countries that are both very corrupt and authoritarian. These governments have survived very high levels of corruption in part because they resort to anti-democratic means of staying in power, such as restricting citizens’ political and civil rights.

The upper right quadrant contains nations with lower levels of corruption and authoritarianism. Chief among these are the Baltic states, which have enjoyed a high degree of stability. Georgia, although it experienced a revolution in 2003, has been more politically stable in recent years.

The lower right quadrant is a null set. We just don’t see countries that are very authoritarian but not very corrupt in this region. An example of a non-Eurasian country that sits in this quadrant would be the United Arab Emirates.

And then there’s the upper left quadrant: states that are less authoritarian but have high levels of corruption. Countries occupying this space have experienced lots of political instability. Kyrgyzstan has had two revolutions in the last decade: the Tulip Revolution of 2005, and the more violent second Kyrgyz revolution in 2010. Moldova suffered widespread unrest in 2009 (the so-called Twitter Revolution), although recent trends point to a more democratic and pro-European direction. And Ukraine had the Orange Revolution in 2004 before the political order was upended again last week as a result of Euromaidan.

Of course, there are many other factors that determine how likely a government is to fall. Economic growth and inequality surely play a part, as do the personalities and governing styles of individual leaders. Yakukovych, for example, was indecisive and incompetent, and many of his allies quickly abandoned him.

So what are the lessons here? Well, if you are going to blatantly siphon money away from your constituents while ignoring many of their basic needs, you better rule with an iron fist. If not, they are going to rise up and throw you out. Or better yet, don’t run a corrupt regime in the first place.

The events in Ukraine illustrate how a relatively democratic society, with a strong civil society and a (mostly) free press can be an important check on corruption in government. Although far from being “fully democratic” in the eyes of international indices, Ukraine was democratic and open enough for Euromaidan to take root and ultimately succeed.

What if Ukraine split in two?

If you’re interested in Ukraine, you are probably aware of the country’s east-west political and enthno-linguistic divisions. I wrote about this in a couple of recent posts. Not long ago, I began to wonder what Ukraine would look like if it split into two nations. Now, I don’t think this is going to happen, nor do I think it would be in the best interest of Ukraine. But with protests continuing in Kyiv and in many of  the regions, it’s worth investigating what these two hypothetical nations would look like.

For this exercise, I used data on Ukraine’s oblasts (regions) that I had gathered for an earlier post, and plugged them into Tableau Public. First, I had to decide where to put the new border. I took the vote shares for Yanukovych in the 2010 elections for each region and plotted them in ascending order:

two ukraines vote share

There is a sharp break where the vote share jumps to above 50% – a natural place for the division. Incidentally, it is interesting and unexpected that Zakarpatskaya region, in the far west of the country, had the highest level of Yanukovych support of all the Timoshenko-majority regions. What is going on there?

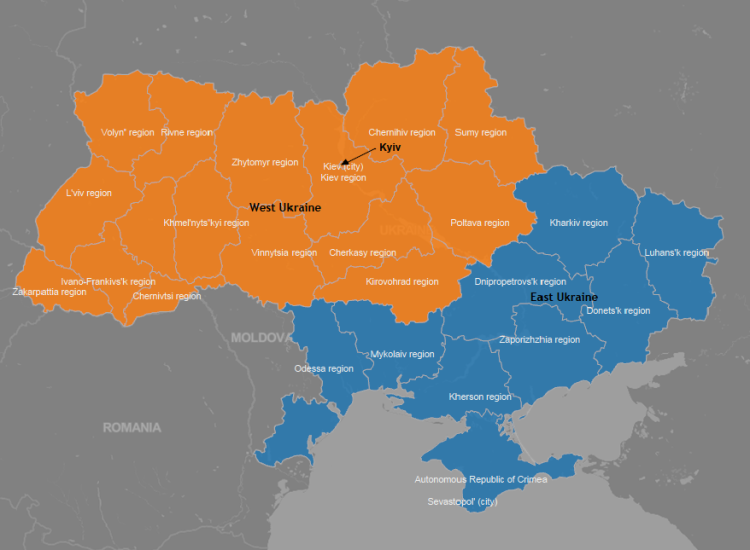
Transferring that division to the map produces the following result:

two ukraines map2

Let’s look at the key features of these two imaginary countries:

two ukraines table

West Ukraine is a bit larger, and has a slightly higher population – ~24 million versus ~21 million. It’s landlocked, and shares borders with all of Ukraine’s current neighbors. East Ukraine has a higher per capita income, and occupies  all of Ukraine’s Black Sea Coast.

Sheet 6

The chart above illustrates some additional features of the countries. East Ukraine is much more urban than the west, and contains many more Russian speakers (although it has a large minority of Ukrainian speakers). West Ukraine has a much smaller minority of Russian speakers.

I encourage you to take a look at the entire interactive visualization in Tableau by clicking on the image below.

Dashboard_1

More on the Regional Political Geography of Ukraine (Interactive Visualization Included)

Last week I wrote a post about Ukraine’s stark regional differences in language, ethnicity, and politics. There was a fair bit of interest, so I found some more data on regional demographic, ethnic, linguistic, and economic indicators in Ukraine and played around a bit in Tableau. I produced this interactive graphic, which illustrates the results of the 2010 presidential election for each region and presents some indicators that were correlated with support for Viktor Yanukovich  (native Russian speakers, ethnic Russians, urban population, and average wage).

I hope to play around some more with these regional data. What sorts of illustrations would you be interested in seeing?

And if you just can’t get enough of Ukrainian regional geography, this guy is the man!

ukr political geography

Click on the image to go to the interactive graphic

Regional Differences in Ethnicity and Language in Ukraine

Note: I now have a new post on Ukrainian political geography complete with an interactive graphic.

If you’ve been following the news, you know that Ukraine is experiencing mass protests and civic unrest. The situation seems to be coming to a head today, with riot police threatening to break up demonstrations in Kyiv and President Viktor Yanukovych talking about meeting with opposition leaders. The protests were triggered when Yanukovych backed out of signing an agreement with the European Union that would increase trade and political cooperation. Things got worse when police beat some unarmed protesters last week. Ukrainians are generally fed up by lack of economic opportunity as well as pervasive corruption, and many seem happy to take to the streets.

Why would Yanukovych refuse to sign the EU agreement after previously promoting it, knowing that it would make a lot of Ukrainians unhappy? Well, the standard answer is that Russia put enormous pressure on Ukraine, including threatening economic retribution. And that’s true. But to grasp why Yakukovych felt comfortable making this decision, and why Russia has such an outsized influence on the country, you have to understand how Ukraine is ethnically, culturally, and linguistically divided  by geography.

Ethnicity

The map above shows the percent of ethnic Russians in each of Ukraine’s oblasts (regional administrative units. About 17 percent of Ukrainians identify as ethnic Russian (2001 census), but they are clustered in the east and south of the country. There is a very sharp drop off in the number of Russians to the north and west of this dividing line, for example from 25.6%  in Kharkov Oblast to 7.2% in Poltava Oblast. There are many historic reasons for this ethnic divide, including migration from Russia in Soviet times to industrial regions in eastern Ukraine, but we won’t get into that now.

Language

Percent of Ukrainians by Oblast whose native language is Russian. About 30 percent of Ukrainians identified as native Russian speakers.

But ethnicity is really only a minor part of the story. The map above shows the percentages of Ukrainians whose native language is Russian. Again you can see the stark divide separating south and east from the rest of the country. Comparing with the ethnicity map you can also see that many Ukrainians who are not ethnic Russians speak Russian as their native language.

Dominant language at the raion (sub-regional) level in Ukraine. Blue is Ukrainian. Red is Russian.

When you look closer, at the sub-regional level, you can actually see that Russian language is concentrated in Crimea and in the large cities and industrial areas of the south and east. Rural areas in the east are predominately Ukrainian speaking. This reminds me of election maps in the United States where Democratic votes are concentrated in dense urban areas, meaning that the map might be awash in a sea of Republican red even if the Democrats won.

Politics

Percent of the vote by region captured by Viktor Yanukovich in the 2010 presidential election.

This ethnic and linguistic divide coincides with a cultural and political divide. The map above shows how much of the vote Yanukovich got in each region in 2010. Even though the election was decided by only about 3.5%, Yanukovych didn’t even get 10% in some areas of western Ukraine while he carried over 90% in Donestk Oblast (where he is from) in the east. That’s a geographically divided electorate!

Eastern and southern Ukraine, especially urban areas, are ethnically, linguistically, and culturally closer to Russia than the other parts of the country. This divide is stark. In my experience as a Peace Corps volunteer working in all-Ukraine summer camps, it was not uncommon for many of the young people to have never met someone from the “other” region. Yanukovych and his Party of Regions have their power base in the east and south, and their supporters are much less likely to be upset at forgoing closer relations with the EU, and much more likely to favor closer relations with Russia. Moreover, the economic threats allegedly made by Putin would have affected the pro-Yanukovich regions more because they are industrial areas that sell lot of goods to Russia.

What next?

So Yanukovych choose a course of action that paralleled the wishes of his power base and his geographic region of support. It remains to be seen whether this was a wise political decision for him, but at this point it does not look good.

Perhaps Yanukovych overestimated the cultural and linguistic divisions in Ukraine, and did not account for the fact  people all over the country are unhappy with the regime, generally perceived as corrupt and ineffectual, and with the economic situation in the country as a whole.

Update: Just an couple hours after I posted this, the Washington Post WorldViews blog published this article. It makes many of the same points regarding the ethnic and liguistic divides in Ukraine and includes some interesting recent polling on the EU integration agreement.