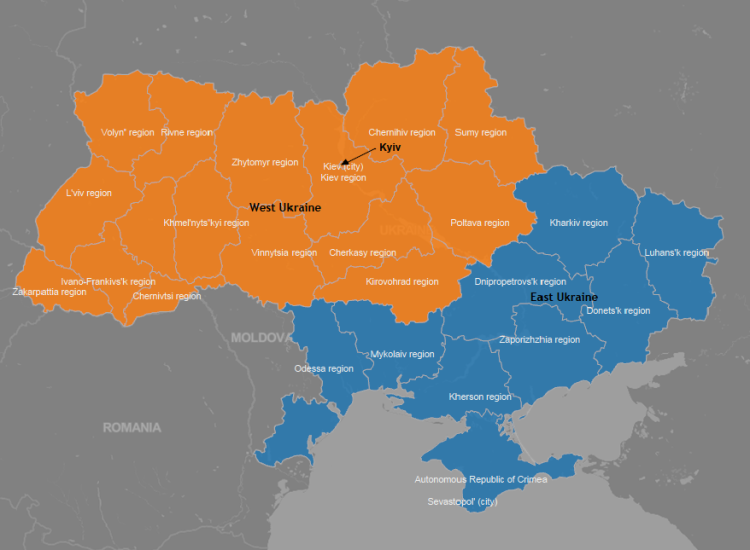
If you’re interested in Ukraine, you are probably aware of the country’s east-west political and enthno-linguistic divisions. I wrote about this in a couple of recent posts. Not long ago, I began to wonder what Ukraine would look like if it split into two nations. Now, I don’t think this is going to happen, nor do I think it would be in the best interest of Ukraine. But with protests continuing in Kyiv and in many of the regions, it’s worth investigating what these two hypothetical nations would look like.
For this exercise, I used data on Ukraine’s oblasts (regions) that I had gathered for an earlier post, and plugged them into Tableau Public. First, I had to decide where to put the new border. I took the vote shares for Yanukovych in the 2010 elections for each region and plotted them in ascending order:
There is a sharp break where the vote share jumps to above 50% – a natural place for the division. Incidentally, it is interesting and unexpected that Zakarpatskaya region, in the far west of the country, had the highest level of Yanukovych support of all the Timoshenko-majority regions. What is going on there?
Transferring that division to the map produces the following result:
Let’s look at the key features of these two imaginary countries:
West Ukraine is a bit larger, and has a slightly higher population – ~24 million versus ~21 million. It’s landlocked, and shares borders with all of Ukraine’s current neighbors. East Ukraine has a higher per capita income, and occupies all of Ukraine’s Black Sea Coast.
The chart above illustrates some additional features of the countries. East Ukraine is much more urban than the west, and contains many more Russian speakers (although it has a large minority of Ukrainian speakers). West Ukraine has a much smaller minority of Russian speakers.
I encourage you to take a look at the entire interactive visualization in Tableau by clicking on the image below.


