I want to write a series of posts about mercury production, prices, and trade. Although this may seem like a rather esoteric subject, I hope to convince readers that it’s actually pretty interesting. I have a professional interest in mercury as a global pollutant, having worked on negotiations for the Minamata Convention. These posts will also be good opportunity to practice data manipulation, graphics, and analysis in R, a powerful programming language for statistical computing.
Mercury is a pretty amazing substance. It’s the only metal that is a liquid at room temperature, a property that has long been a source of fascination to people, and led to a wide range of applications in industry. Unfortunately, mercury is also a toxin that has harmful effects on both people and the environment.
In this post I’ll examine the price and global production of mercury over the last hundred years or so using data from the U.S. Geological Survey. First, let’s look at the price of mercury in constant 1998 dollars since 1900:

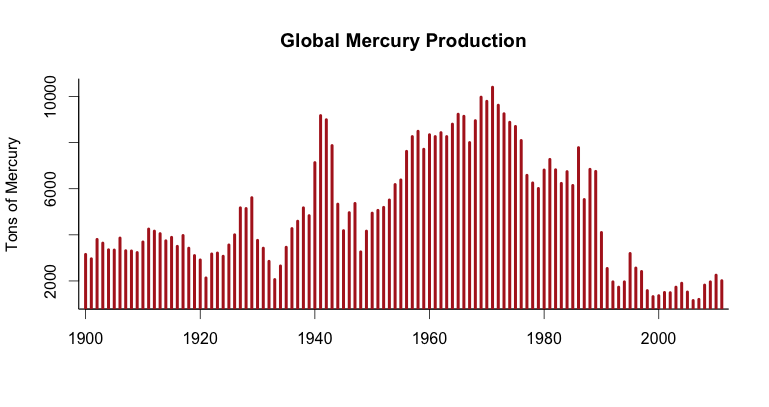
You can see that prices have fluctuated quite a bit. Let’s examine the three prominent peaks in the time series and try to figure out what caused them. Now, high prices could mean increased demand, tight supply, or a combination of both. We need to look at global mercury production over the same time period to help shed light on the variations in mercury price:
The first price peak occurred in the late 19-teens, around the time of WWI. In fact, I would posit that it is a direct consequence of WWI. Mercury fulminate is an explosive compound that was commonly used in the last century as a primer for small arms ammunition. They probably used a lot of it during the First World War.
Incidentally, you may recognize mercury fulminate from the TV show Breaking Bad. Walt made some and used it to blow up a group of rival drug dealers. There’s even a MythBusters segment about it.
The second price spike occurred during WWII. This was likely a result of increased demand for use in fulminate explosives, and perhaps in switches and other such products for wartime equipment. Mercury production actually increased quite a bit during the war, but it was apparently not enough prevent high prices. In response to the German invasion, the Soviets moved their main center of mercury production from Nikitovka in Ukraine to Khaidarkan in Kyrgyzstan. I’ll talk about both of these places in a later post.
The last price peak occurred in the 1960s. The causes are a bit more complex. My guess is that a combination of industrial and military uses were driving up demand, and production, although increasing, could not keep up. During this time the United States was building up its national defense reserves of mercury, and other countries were probably doing the same. One defense-related use of mercury was to separate lithium isotopes for use in hydrogen bombs. Hundreds of tons of mercury were spilled at Oak Ridge National Laboratory during isotope separation, and environmental contamination remains to this day. Another use of mercury that never came to be was as a coolant (to replace water) for nuclear reactors.
These were heady days in the mercury business, before the human health and environmental impacts were widely know. This fascinating newsreel from 1955 gives you a flavor of what the times were like:
Mercury prices (and production) started dropping in the 1970s as alternatives to industrial uses were found and the health risks started to become clear. But prices have been growing rapidly in recent years. In the next post I’m going to examine this and look at the degree to which artisanal gold mining might be responsible.

Good to see your econ training is being used as well as your geo passion!
Hi, i couldn’t find the data in the data on Mercury prices and production in the web page you shared (https://www.usgs.gov/energy-and-minerals/mineral-resources-program). Would you mind to share it?
Best
Hi! Try this: https://www.usgs.gov/centers/nmic/historical-statistics-mineral-and-material-commodities-united-states#mercury